See how work actually flows
through your team.
Connect your Linear workspace and Team Metrics shows you what your team works on, how long things really take, what's quietly piling up — and what you're not doing.
From “we should track this” to charts
on the wall in 30 seconds.
No agents, no scripts, no data warehouse. Just sign in.
Questions you can finally answer
on a Tuesday afternoon.
These are the defaults. Everything below is configurable — swap definitions, add custom metrics, or pipe results into Slack.
What is my team working on?
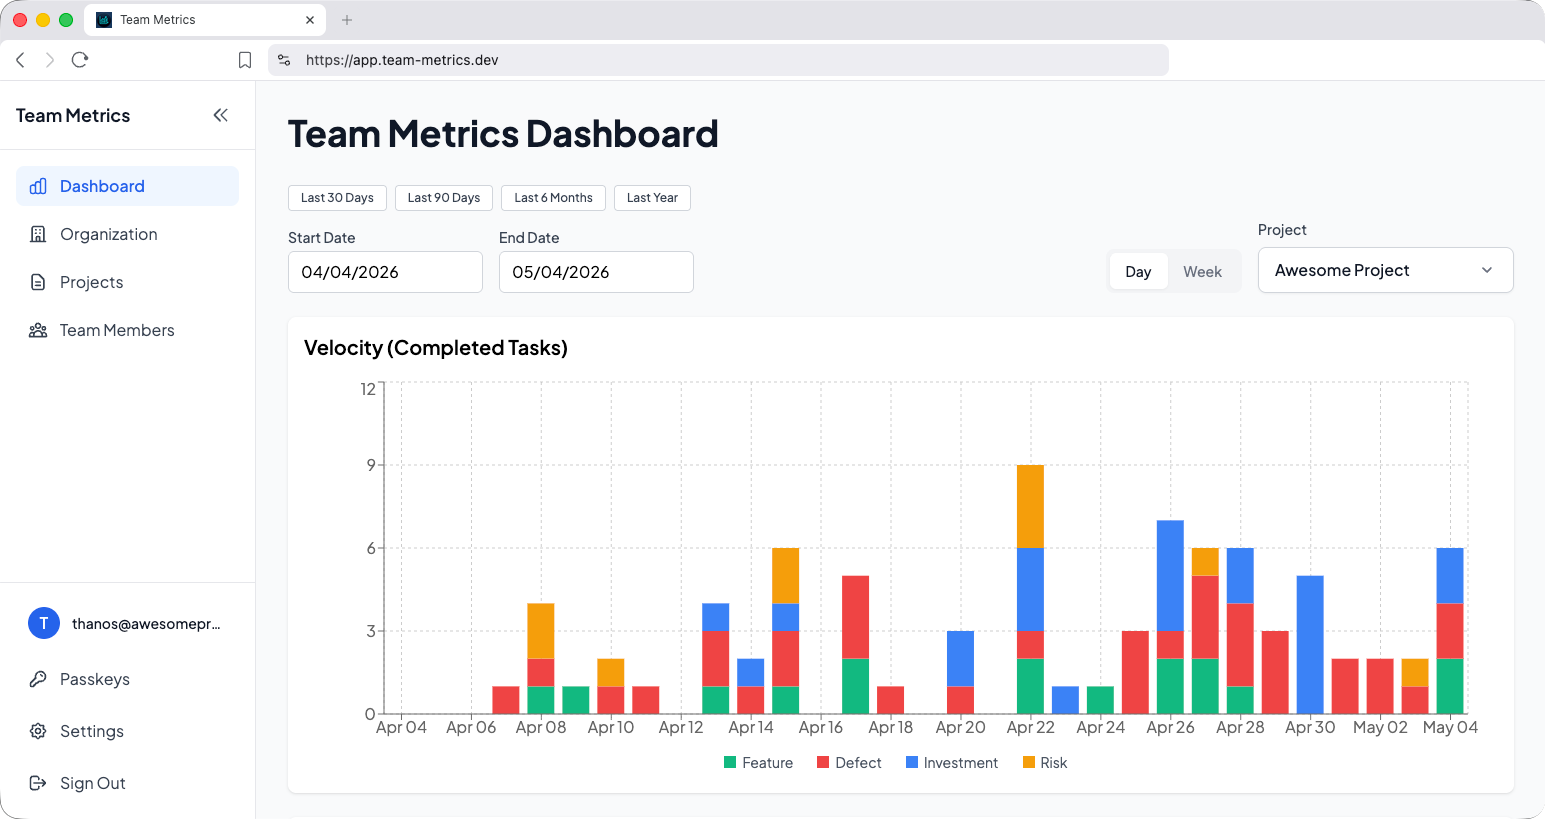
Slice work by your own labels and teams — features, infra, support — and watch the mix shift week over week.
How much time goes to bugs vs. building?
Track the split between fixing what's broken and shipping new value, so you can tell when bug-tax is creeping up before it becomes the quarter.
How long does work actually take?
See cycle time from “started” to “done” across teams, labels, and issue size — with the outliers called out, not averaged away.
What's quietly piling up?
Find the work-in-progress that's been “in review” for nine days and surface it before standup, not after the sprint.
One tool, three jobs.
“I can diagnose high-level problems and know where to look.”
- Daily digest email
- 1:1 prep cheatsheet
“I can tell whether we’re paying down enough technical debt or just plowing through tickets.”
- Work-mix breakdown
- Delivery time by label
- Sprint retrospectives with data
“High-level metrics on the health of the business — without poking my CTO every Friday.”
- Set up in 30 seconds
- No PM ceremony required
- Email-friendly weekly summary
FAQ
Stop guessing how the
team is actually doing.
Free for early teams. Setup takes 30 seconds. You'll see your first chart before your coffee gets cold.